TauPlot - Charts & Plotting Addon
An asset by ze2j
Install Asset
Install via Godot
To maintain one source of truth, Godot Asset Library is just a mirror of the old asset library so you can download directly on Godot via the integrated asset library browser

Quick Information

TauPlot - Charts & Plotting Addon
TauPlot is a charting and data visualization addon for Godot 4.5+.Create bar charts, scatter plots, multi-series graphs, live dashboards, and multi-pane (subplot) layouts directly inside any Godot UI. Pure GDScript, no external dependencies, fully themeable.Use it for in-game analytics, telemetry overlays, scientific plots, sensor readouts, debug HUDs, financial views, or any tool that needs interactive charts. TauPlot is actively developed and the chart catalogue is growing, with line, area, pie, and radar plots on the roadmap.Features:- Bar charts and scatter plots can be combined freely in one chart. Bars support grouped, stacked (with optional normalization), and independent layout modes.- Full Godot theme integration with a three-layer cascade (built-in defaults, Godot theme, code overrides) so charts match the rest of your UI without per-property work.- Categorical and continuous axes with linear or logarithmic scales, axis inversion, and custom tick label formatting.- Automatic tick and tick label generation with overlap prevention, so axes stay readable at any plot size without manual tuning.- Real-time data streaming powered by ring-buffer datasets. The chart redraws incrementally as samples arrive and the oldest points are dropped when the buffer is full.- Multi-pane layouts (also known as subplots) for stacked graphs that share an X axis but use different Y scales.- Hover inspection with tooltip, crosshair, and sample highlight, plus four signals (sample_hovered, sample_hover_exited, sample_clicked, sample_click_dismissed) so you can wire chart interaction into your own UI.- Per-sample visual control over color, alpha, marker shape, marker size, and outline, set either through attribute buffers or callbacks.- GPU-accelerated scatter rendering built on Godot's MultiMesh, with seven built-in marker shapes (circle, square, triangle up and down, diamond, cross, plus).- Configurable legend with placement inside or outside the plot area and configurable flow direction.Requires Godot 4.5 or later.
Supported Engine Version
4.5
Version String
0.1.2
License Version
BSD-3-Clause
Support Level
community
Modified Date
2 months ago
Git URL
Issue URL
TauPlot
A pure GDScript charting addon for Godot 4.5+. No external dependencies. Interactive, performant, and fully themeable.
TauPlot draws XY plots inside any Godot UI. It supports bar and scatter overlays (with more to come), real-time data streaming, multi-pane layouts, per-sample visual control, and deep integration with Godot's theme system.
Features
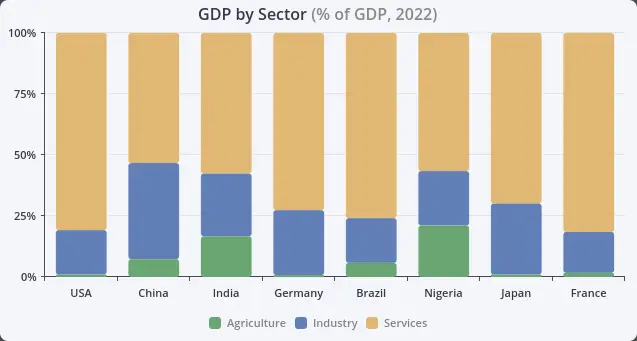
- Bar and scatter overlays in any combination within a single plot. Bars support grouped, stacked (with optional normalization), and independent modes.
- Real-time streaming with ring-buffer datasets. When the buffer is full, the oldest sample is dropped automatically, making TauPlot a good fit for live dashboards and sensor data.
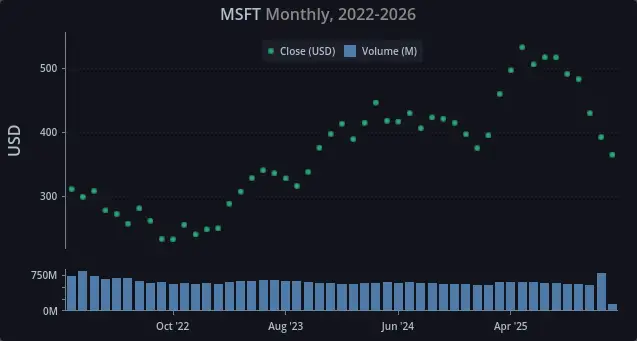
- Multi-pane layouts for displaying series with different Y scales side by side (e.g. price above volume).
- Per-sample styling through attribute buffers or callbacks. Control color, alpha, marker shape, marker size, outline, and more on a per-sample basis.
- Godot theme integration with a three-layer cascade: built-in defaults, Godot theme, code overrides. Every visual property participates in this cascade.
- Hover inspection with configurable tooltip, crosshair, and highlight. Four signals (
sample_hovered,sample_hover_exited,sample_clicked,sample_click_dismissed) let you react to user interaction. - GPU-accelerated scatter rendering using MultiMesh and a custom SDF shader. Seven built-in marker shapes (circle, square, triangle up/down, diamond, cross, plus) with per-sample shape assignment.
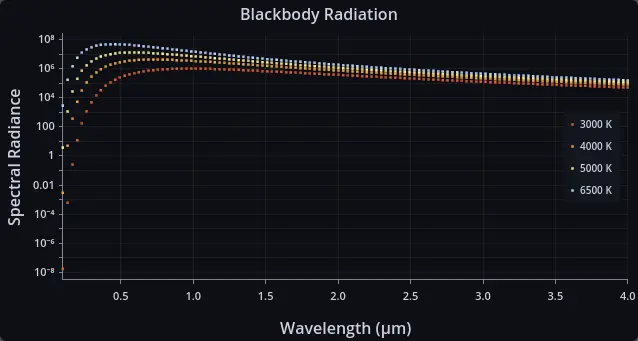
- Categorical and continuous axes, with linear or logarithmic scales, axis inversion, tick formatting callbacks, and automatic label overlap prevention.
- Legend with configurable placement (inside or outside the plot) and flow direction.
Quick start
Create a scene with a CenterContainer root node. Add a TauPlot child node named MyPlot and give it a custom_minimum_size of at least 600 x 400. Attach the following script to the root node:
extends CenterContainer

func _ready() -> void:
    var dataset := TauPlot.Dataset.make_shared_x_categorical(
        PackedStringArray(["Revenue", "Costs"]),
        PackedStringArray(["Q1", "Q2", "Q3", "Q4"]),
        [
            PackedFloat64Array([120.0, 135.0, 148.0, 160.0]),
            PackedFloat64Array([90.0, 95.0, 100.0, 108.0]),
        ]
    )

    var x_axis := TauAxisConfig.new()
    x_axis.type = TauAxisConfig.Type.CATEGORICAL

    var y_axis := TauAxisConfig.new()
    y_axis.title = "EUR"

    var bar_overlay_config := TauBarConfig.new()

    var pane := TauPaneConfig.new()
    pane.y_left_axis = y_axis
    pane.overlays = [bar_overlay_config]

    var config := TauXYConfig.new()
    config.x_axis = x_axis
    config.panes = [pane]

    var b0 := TauXYSeriesBinding.new()
    b0.series_id = dataset.get_series_id_by_index(0)
    b0.pane_index = 0
    b0.overlay_type = TauXYSeriesBinding.PaneOverlayType.BAR
    b0.y_axis_id = TauPlot.AxisId.LEFT

    var b1 := TauXYSeriesBinding.new()
    b1.series_id = dataset.get_series_id_by_index(1)
    b1.pane_index = 0
    b1.overlay_type = TauXYSeriesBinding.PaneOverlayType.BAR
    b1.y_axis_id = TauPlot.AxisId.LEFT

    var bindings: Array[TauXYSeriesBinding] = [b0, b1]

    $MyPlot.title = "Quick Start Example"
    $MyPlot.plot_xy(dataset, config, bindings)
This example is available as examples/quick_start.tscn.
Documentation
- Getting Started walks through building your first plot step by step.
- API Reference covers every class, property, enum, and signal.
- The tests folder contains self-contained examples of most features.
Stability
The API may change between releases until version 1.0 is reached. Breaking changes will be documented in the changelog. Backward compatibility is taken seriously and disruption will be kept to a minimum, but at this stage correctness and design quality take priority over freezing the API.
Roadmap
Planned for upcoming releases:
- Line and area overlays for XY plots.
- Interactive legend with click-to-toggle series visibility.
- Pie and radar plot types.
License
TauPlot is released under the BSD 3-Clause License.
TauPlot is a charting and data visualization addon for Godot 4.5+.
Create bar charts, scatter plots, multi-series graphs, live dashboards, and multi-pane (subplot) layouts directly inside any Godot UI. Pure GDScript, no external dependencies, fully themeable.
Use it for in-game analytics, telemetry overlays, scientific plots, sensor readouts, debug HUDs, financial views, or any tool that needs interactive charts. TauPlot is actively developed and the chart catalogue is growing, with line, area, pie, and radar plots on the roadmap.
Features:
- Bar charts and scatter plots can be combined freely in one chart. Bars support grouped, stacked (with optional normalization), and independent layout modes.
- Full Godot theme integration with a three-layer cascade (built-in defaults, Godot theme, code overrides) so charts match the rest of your UI without per-property work.
- Categorical and continuous axes with linear or logarithmic scales, axis inversion, and custom tick label formatting.
- Automatic tick and tick label generation with overlap prevention, so axes stay readable at any plot size without manual tuning.
- Real-time data streaming powered by ring-buffer datasets. The chart redraws incrementally as samples arrive and the oldest points are dropped when the buffer is full.
- Multi-pane layouts (also known as subplots) for stacked graphs that share an X axis but use different Y scales.
- Hover inspection with tooltip, crosshair, and sample highlight, plus four signals (sample_hovered, sample_hover_exited, sample_clicked, sample_click_dismissed) so you can wire chart interaction into your own UI.
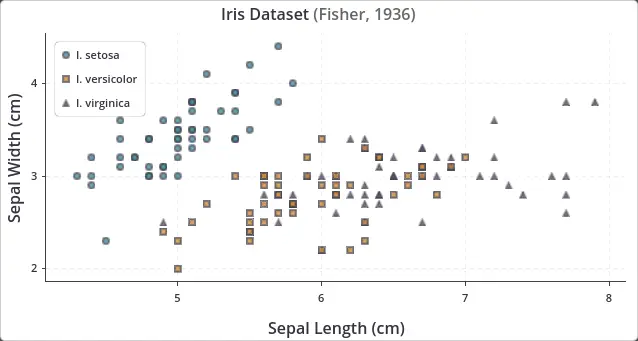
- Per-sample visual control over color, alpha, marker shape, marker size, and outline, set either through attribute buffers or callbacks.
- GPU-accelerated scatter rendering built on Godot's MultiMesh, with seven built-in marker shapes (circle, square, triangle up and down, diamond, cross, plus).
- Configurable legend with placement inside or outside the plot area and configurable flow direction.
Requires Godot 4.5 or later.
Reviews
Quick Information
TauPlot - Charts & Plotting Addon
TauPlot is a charting and data visualization addon for Godot 4.5+.Create bar charts, scatter plots, multi-series graphs, live dashboards, and multi-pane (subplot) layouts directly inside any Godot UI. Pure GDScript, no external dependencies, fully themeable.Use it for in-game analytics, telemetry overlays, scientific plots, sensor readouts, debug HUDs, financial views, or any tool that needs interactive charts. TauPlot is actively developed and the chart catalogue is growing, with line, area, pie, and radar plots on the roadmap.Features:- Bar charts and scatter plots can be combined freely in one chart. Bars support grouped, stacked (with optional normalization), and independent layout modes.- Full Godot theme integration with a three-layer cascade (built-in defaults, Godot theme, code overrides) so charts match the rest of your UI without per-property work.- Categorical and continuous axes with linear or logarithmic scales, axis inversion, and custom tick label formatting.- Automatic tick and tick label generation with overlap prevention, so axes stay readable at any plot size without manual tuning.- Real-time data streaming powered by ring-buffer datasets. The chart redraws incrementally as samples arrive and the oldest points are dropped when the buffer is full.- Multi-pane layouts (also known as subplots) for stacked graphs that share an X axis but use different Y scales.- Hover inspection with tooltip, crosshair, and sample highlight, plus four signals (sample_hovered, sample_hover_exited, sample_clicked, sample_click_dismissed) so you can wire chart interaction into your own UI.- Per-sample visual control over color, alpha, marker shape, marker size, and outline, set either through attribute buffers or callbacks.- GPU-accelerated scatter rendering built on Godot's MultiMesh, with seven built-in marker shapes (circle, square, triangle up and down, diamond, cross, plus).- Configurable legend with placement inside or outside the plot area and configurable flow direction.Requires Godot 4.5 or later.
Supported Engine Version
4.5
Version String
0.1.2
License Version
BSD-3-Clause
Support Level
community
Modified Date
2 months ago
Git URL
Issue URL