Install Asset
Install via Godot
To maintain one source of truth, Godot Asset Library is just a mirror of the old asset library so you can download directly on Godot via the integrated asset library browser

Quick Information

A tool for sending metrics and logs from Godot, into Grafana Cloud.Detailed setup instructions available at: https://github.com/KurzweilTV/godot-grafana-connectorSetupGrafana CloudYou'll need a Grafana Cloud account. If you don’t have one, you can sign up here.Once logged in, navigate to Connections on the left, then follow the instructions below depending on whether you want to send Metrics or Logs.Metrics SetupFrom the Add New Connection screen, choose HTTP Metrics (Custom Data).For Metrics Format, choose Prometheus.Generate an API Key.Copy the URL, USER_ID, and API_KEY to use in the Godot script.Note: You might find this easier if you choose the Python option.Logs SetupFrom the Add New Connection screen, choose Logs Onboarding (Custom Data).Choose Collect, store, and manage logs in Grafana Cloud.Choose Logs HTTP.Generate an API Key.Copy the URL, USER_ID, and API_KEY to use in the Godot script.Note: You might find this easier if you choose the Python option.Godot IntegrationOnce you download the plugin, place it in res://addons/grafana_cloud_connector/.Note: The download includes an optional examples/ folder containing a test scene to verify that your setup is working.Enable the PluginFrom the menu bar, choose Project -> Project Settings, then click the Plugins tab.Enable the plugin, then restart Godot (or reload your project).The plugin should now be enabled.Script ConfigurationYou'll need to add the information you copied from Grafana Cloud into the loki.gd and prometheus.gd scripts located at res://addons/grafana_cloud_connector/scripts/.In these scripts, you can also configure the game_name, which will be added as a label to every metric/log, helping you organize your data in Grafana.UsageMetricsTo send a metric from anywhere in your project, use:Grafana.prometheus.send_metric("metric_name", 123, {"Optional": "Labels"})metric_name (string) and metric (float) are required.Labels are optional but help in organizing your data in Grafana.LogsTo send log lines from anywhere in your project, use:Grafana.loki.send_log("log line goes here", "level", {"Optional": "Labels"})log line is required.level and labels are optional, but it's recommended to add a log level for automatic categorization in Grafana.Recognized Log Levels:"debug""info""warning""error"Auto InstrumentationThe plugin includes a scene for automatically collecting metrics globally from the engine.Add the scene located at res://addons/grafana_cloud_connector/scenes/MetricsCollector.tscn anywhere in your project. Once configured, performance metrics will be sent to Grafana every minute.
Godot Grafana Cloud Connector
This is a simple Godot plugin for anyone that wants to send data from their Godot project to Grafana Cloud.
Setup
Grafana Cloud
You'll need a Grafana Cloud account. If you don’t have one, you can sign up here.
Once logged in, navigate to Connections on the left, then follow the instructions below depending on whether you want to send Metrics or Logs.
Metrics Setup
- From the Add New Connection screen, choose
HTTP Metrics (Custom Data). - For Metrics Format, choose
Prometheus. - Generate an API Key.
- Copy the URL, USER_ID, and API_KEY to use in the Godot script.
- Note: You might find this easier if you choose the Python option.
Logs Setup
- From the Add New Connection screen, choose
Logs Onboarding (Custom Data). - Choose Collect, store, and manage logs in Grafana Cloud.
- Choose
Logs HTTP. - Generate an API Key.
- Copy the URL, USER_ID, and API_KEY to use in the Godot script.
- Note: You might find this easier if you choose the Python option.
Godot Integration
Once you download the plugin, place it in res://addons/grafana_cloud_connector/.
Note: The download includes an optional examples/ folder containing a test scene to verify that your setup is working.
Enable the Plugin
- From the menu bar, choose Project -> Project Settings, then click the Plugins tab.
- Enable the plugin, then restart Godot (or reload your project).
The plugin should now be enabled.
Script Configuration
You'll need to add the information you copied from Grafana Cloud into the loki.gd and prometheus.gd scripts located at res://addons/grafana_cloud_connector/scripts/.
In these scripts, you can also configure the game_name, which will be added as a label to every metric/log, helping you organize your data in Grafana.
Usage
Metrics
To send a metric from anywhere in your project, use:
Grafana.prometheus.send_metric("metric_name", 123, {"Optional": "Labels"})
- metric_name (string) and metric (float) are required.
- Labels are optional but help in organizing your data in Grafana.
Logs
To send log lines from anywhere in your project, use:
Grafana.loki.send_log("log line goes here", "level", {"Optional": "Labels"})
- log line is required.
- level and labels are optional, but it's recommended to add a log level for automatic categorization in Grafana.
Recognized Log Levels:
"debug""info""warning""error"
Auto Instrumentation
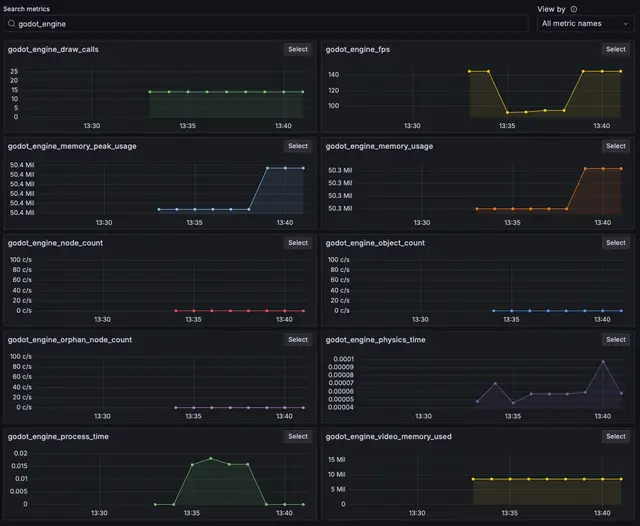
The plugin includes a scene for automatically collecting metrics globally from the engine.
Add the scene located at res://addons/grafana_cloud_connector/scenes/MetricsCollector.tscn anywhere in your project. Once configured, performance metrics will be sent to Grafana every minute.
Note: More frequent metrics may be possible with a paid Grafana Cloud account. This can be configured in the
EngineMetrics.gdscript.
A tool for sending metrics and logs from Godot, into Grafana Cloud.
Detailed setup instructions available at: https://github.com/KurzweilTV/godot-grafana-connector
Setup
Grafana Cloud
You'll need a Grafana Cloud account. If you don’t have one, you can sign up here.
Once logged in, navigate to Connections on the left, then follow the instructions below depending on whether you want to send Metrics or Logs.
Metrics Setup
From the Add New Connection screen, choose HTTP Metrics (Custom Data).
For Metrics Format, choose Prometheus.
Generate an API Key.
Copy the URL, USER_ID, and API_KEY to use in the Godot script.
Note: You might find this easier if you choose the Python option.
Logs Setup
From the Add New Connection screen, choose Logs Onboarding (Custom Data).
Choose Collect, store, and manage logs in Grafana Cloud.
Choose Logs HTTP.
Generate an API Key.
Copy the URL, USER_ID, and API_KEY to use in the Godot script.
Note: You might find this easier if you choose the Python option.
Godot Integration
Once you download the plugin, place it in res://addons/grafana_cloud_connector/.
Note: The download includes an optional examples/ folder containing a test scene to verify that your setup is working.
Enable the Plugin
From the menu bar, choose Project -> Project Settings, then click the Plugins tab.
Enable the plugin, then restart Godot (or reload your project).
The plugin should now be enabled.
Script Configuration
You'll need to add the information you copied from Grafana Cloud into the loki.gd and prometheus.gd scripts located at res://addons/grafana_cloud_connector/scripts/.
In these scripts, you can also configure the game_name, which will be added as a label to every metric/log, helping you organize your data in Grafana.
Usage
Metrics
To send a metric from anywhere in your project, use:
Grafana.prometheus.send_metric("metric_name", 123, {"Optional": "Labels"})
metric_name (string) and metric (float) are required.
Labels are optional but help in organizing your data in Grafana.
Logs
To send log lines from anywhere in your project, use:
Grafana.loki.send_log("log line goes here", "level", {"Optional": "Labels"})
log line is required.
level and labels are optional, but it's recommended to add a log level for automatic categorization in Grafana.
Recognized Log Levels:
"debug"
"info"
"warning"
"error"
Auto Instrumentation
The plugin includes a scene for automatically collecting metrics globally from the engine.
Add the scene located at res://addons/grafana_cloud_connector/scenes/MetricsCollector.tscn anywhere in your project. Once configured, performance metrics will be sent to Grafana every minute.
Reviews
Quick Information

A tool for sending metrics and logs from Godot, into Grafana Cloud.Detailed setup instructions available at: https://github.com/KurzweilTV/godot-grafana-connectorSetupGrafana CloudYou'll need a Grafana Cloud account. If you don’t have one, you can sign up here.Once logged in, navigate to Connections on the left, then follow the instructions below depending on whether you want to send Metrics or Logs.Metrics SetupFrom the Add New Connection screen, choose HTTP Metrics (Custom Data).For Metrics Format, choose Prometheus.Generate an API Key.Copy the URL, USER_ID, and API_KEY to use in the Godot script.Note: You might find this easier if you choose the Python option.Logs SetupFrom the Add New Connection screen, choose Logs Onboarding (Custom Data).Choose Collect, store, and manage logs in Grafana Cloud.Choose Logs HTTP.Generate an API Key.Copy the URL, USER_ID, and API_KEY to use in the Godot script.Note: You might find this easier if you choose the Python option.Godot IntegrationOnce you download the plugin, place it in res://addons/grafana_cloud_connector/.Note: The download includes an optional examples/ folder containing a test scene to verify that your setup is working.Enable the PluginFrom the menu bar, choose Project -> Project Settings, then click the Plugins tab.Enable the plugin, then restart Godot (or reload your project).The plugin should now be enabled.Script ConfigurationYou'll need to add the information you copied from Grafana Cloud into the loki.gd and prometheus.gd scripts located at res://addons/grafana_cloud_connector/scripts/.In these scripts, you can also configure the game_name, which will be added as a label to every metric/log, helping you organize your data in Grafana.UsageMetricsTo send a metric from anywhere in your project, use:Grafana.prometheus.send_metric("metric_name", 123, {"Optional": "Labels"})metric_name (string) and metric (float) are required.Labels are optional but help in organizing your data in Grafana.LogsTo send log lines from anywhere in your project, use:Grafana.loki.send_log("log line goes here", "level", {"Optional": "Labels"})log line is required.level and labels are optional, but it's recommended to add a log level for automatic categorization in Grafana.Recognized Log Levels:"debug""info""warning""error"Auto InstrumentationThe plugin includes a scene for automatically collecting metrics globally from the engine.Add the scene located at res://addons/grafana_cloud_connector/scenes/MetricsCollector.tscn anywhere in your project. Once configured, performance metrics will be sent to Grafana every minute.

