Rider Launch
An asset by Meta-Ben
Install Asset
Install via Godot
To maintain one source of truth, Godot Asset Library is just a mirror of the old asset library so you can download directly on Godot via the integrated asset library browser
Quick Information


Rider Launch
This plugin help developer that use Jetbrain Rider IDE to fix an issue In Jetbrain Rider IDE you can run your GDScript project with the "Player GDScript" target in debug, then the Rider IDE had debug tools BUT if you run your project from Godot Engine, Rider IDE don't have debug tools opening ( since he doesnt know that your project is running )with this plugin and the help on a Jetbrain Plugin : https://plugins.jetbrains.com/plugin/27239-expose-run-debug/edit you can expose the run / debug targets and run them from godot This plugin will replace the original Godot engine play button by a new one calling the opened Rider IDE that expose the same target port and play run on it, allowing you to get the Rider IDE debug session
Supported Engine Version
4.2
Version String
1.0.0
License Version
MIT
Support Level
community
Modified Date
9 months ago
Git URL
Issue URL
🚀 Rider Launch Godot Plugin 🔌

NOTE : if you want to help us and/or participate on improving this plugin don't hesitate to open a PR 📥
A plugin for Godot Engine written fully in GDScript, that lets you launch a JetBrains Rider configuration directly from Godo
⚠️ Beware !! You will need to have Expose Run/Debug Jetbrain Rider Plugin installed on your Rider IDE. ⚠️
📃 How to use it
1 - Clone the repository or download the .zip file and unzip it:
git clone https://github.com/Meta-Ben/RiderLaunchPlugin
2 - Move the RiderLaunchPlugin folder into the addons directory of your Godot project. If the folder doesn’t exist, create it.
3 - In Godot, navigate to Project -> Project Settings -> Plugins, then enable the plugin RiderLaunchPlugin.
4 - After enabling the plugin, you should notice .. Nothing 😛, cause this plugin replace the actual play button
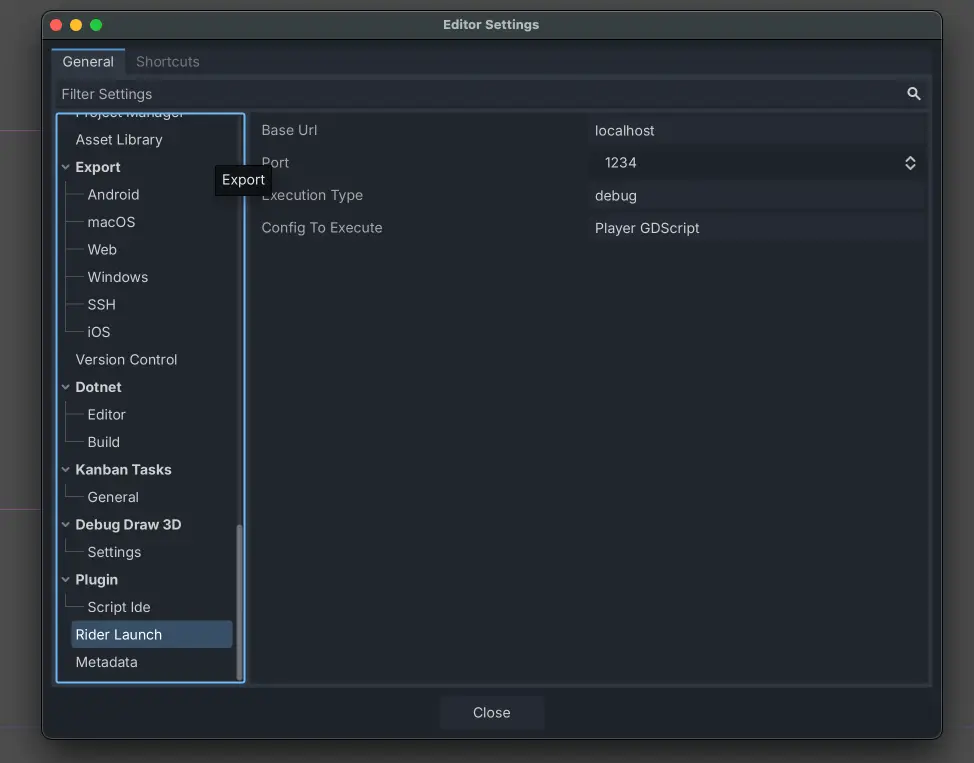
5 - But under Editor -> Editor Settings -> General -> Rider launcher you should have configurable parameters ! ( all should be setup as the same as the defaults config for Expose Run/Debug , you can do modifications, but they should match with you're Rider configuration

6 - Check the expose run/debug plugin settings in rider, the port should match

7 - Check the run/debug config name in rider it should aslo match

8 - Then press play button on Godot, this should launch your project as normal, but Rider should start monitoring the code too ! 🎉
You should see this in Rider IDE : 
⚙️ Configuration documentation
Base Url -> Its the IP address of the Rider IDE instance you want to target ( localhost or 127.0.0.1 by default since you mainly want to target your own machine )
Port -> Its the port of the Rider IDE instance you want to target ( ⚠️ this should match the exposing port in the Expose Run/Debug plugin settings of your Rider IDE )
Execution Type -> Its the type of execution you want ( Officialy only debug is available for godot in GDScript, but run is also available for C# )
Config to Execute -> Its the name of the run/debug config you want to execute ( by default its Player GDScript, because its the one Rider with the Godot plugin set, but it can be changed, like the port it should match on both side )
This plugin help developer that use Jetbrain Rider IDE to fix an issue
In Jetbrain Rider IDE you can run your GDScript project with the "Player GDScript" target in debug, then the Rider IDE had debug tools
BUT if you run your project from Godot Engine, Rider IDE don't have debug tools opening ( since he doesnt know that your project is running )
with this plugin and the help on a Jetbrain Plugin : https://plugins.jetbrains.com/plugin/27239-expose-run-debug/edit you can expose the run / debug targets and run them from godot
This plugin will replace the original Godot engine play button by a new one calling the opened Rider IDE that expose the same target port and play run on it, allowing you to get the Rider IDE debug session
Reviews
Quick Information
Rider Launch
This plugin help developer that use Jetbrain Rider IDE to fix an issue In Jetbrain Rider IDE you can run your GDScript project with the "Player GDScript" target in debug, then the Rider IDE had debug tools BUT if you run your project from Godot Engine, Rider IDE don't have debug tools opening ( since he doesnt know that your project is running )with this plugin and the help on a Jetbrain Plugin : https://plugins.jetbrains.com/plugin/27239-expose-run-debug/edit you can expose the run / debug targets and run them from godot This plugin will replace the original Godot engine play button by a new one calling the opened Rider IDE that expose the same target port and play run on it, allowing you to get the Rider IDE debug session
Supported Engine Version
4.2
Version String
1.0.0
License Version
MIT
Support Level
community
Modified Date
9 months ago
Git URL
Issue URL