SignalVisualizer
An asset by MiniGameDev
Install Asset
Install via Godot
To maintain one source of truth, Godot Asset Library is just a mirror of the old asset library so you can download directly on Godot via the integrated asset library browser


Quick Information

SignalVisualizer
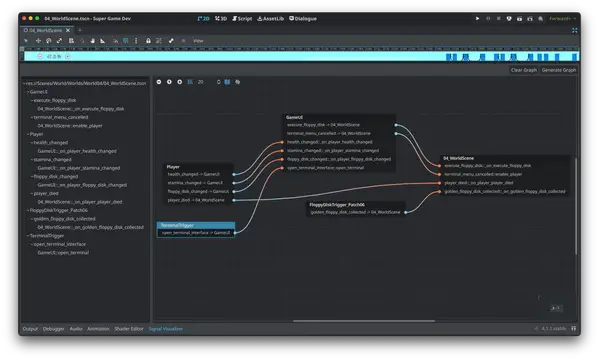
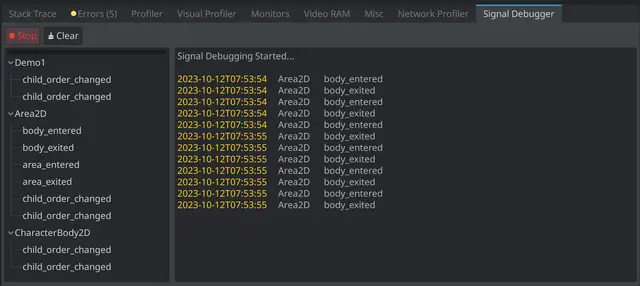
The SignalVisuzlizer plugin comes with two tools to help with managing and debugging your scene's signals.The first tool is the visualizer. This displays the current scene's signals and their connections in an easy to read graph and tree.The second tool is the debugger. With a running scene, activate the debugger to automatically log all relevant signals to the custom Signal Debugger panel.
Supported Engine Version
4.0
Version String
1.7.0
License Version
MIT
Support Level
community
Modified Date
1 year ago
Git URL
Issue URL
SignalVisualizer
A plugin for Godot 4.x. SignalVisualizer displays the current scene's signals and connections in a easy to read graph and tree dock.

Installation
The SignalVisualizer plugin can be installed via Godot's Asset Library or from source.
Source Installation via Github
- Download the repo
- Copy the
addons/SignalVisualizerdirectory to your project'sres://addons/directory. - Enable the plugin under Project Settings -> Plugins

- Ensure the Autoload singleton is enabled. The plugin adds the autoload automatically.

- The
Signal Visualizertab will display in the bottom dock region.

Usage
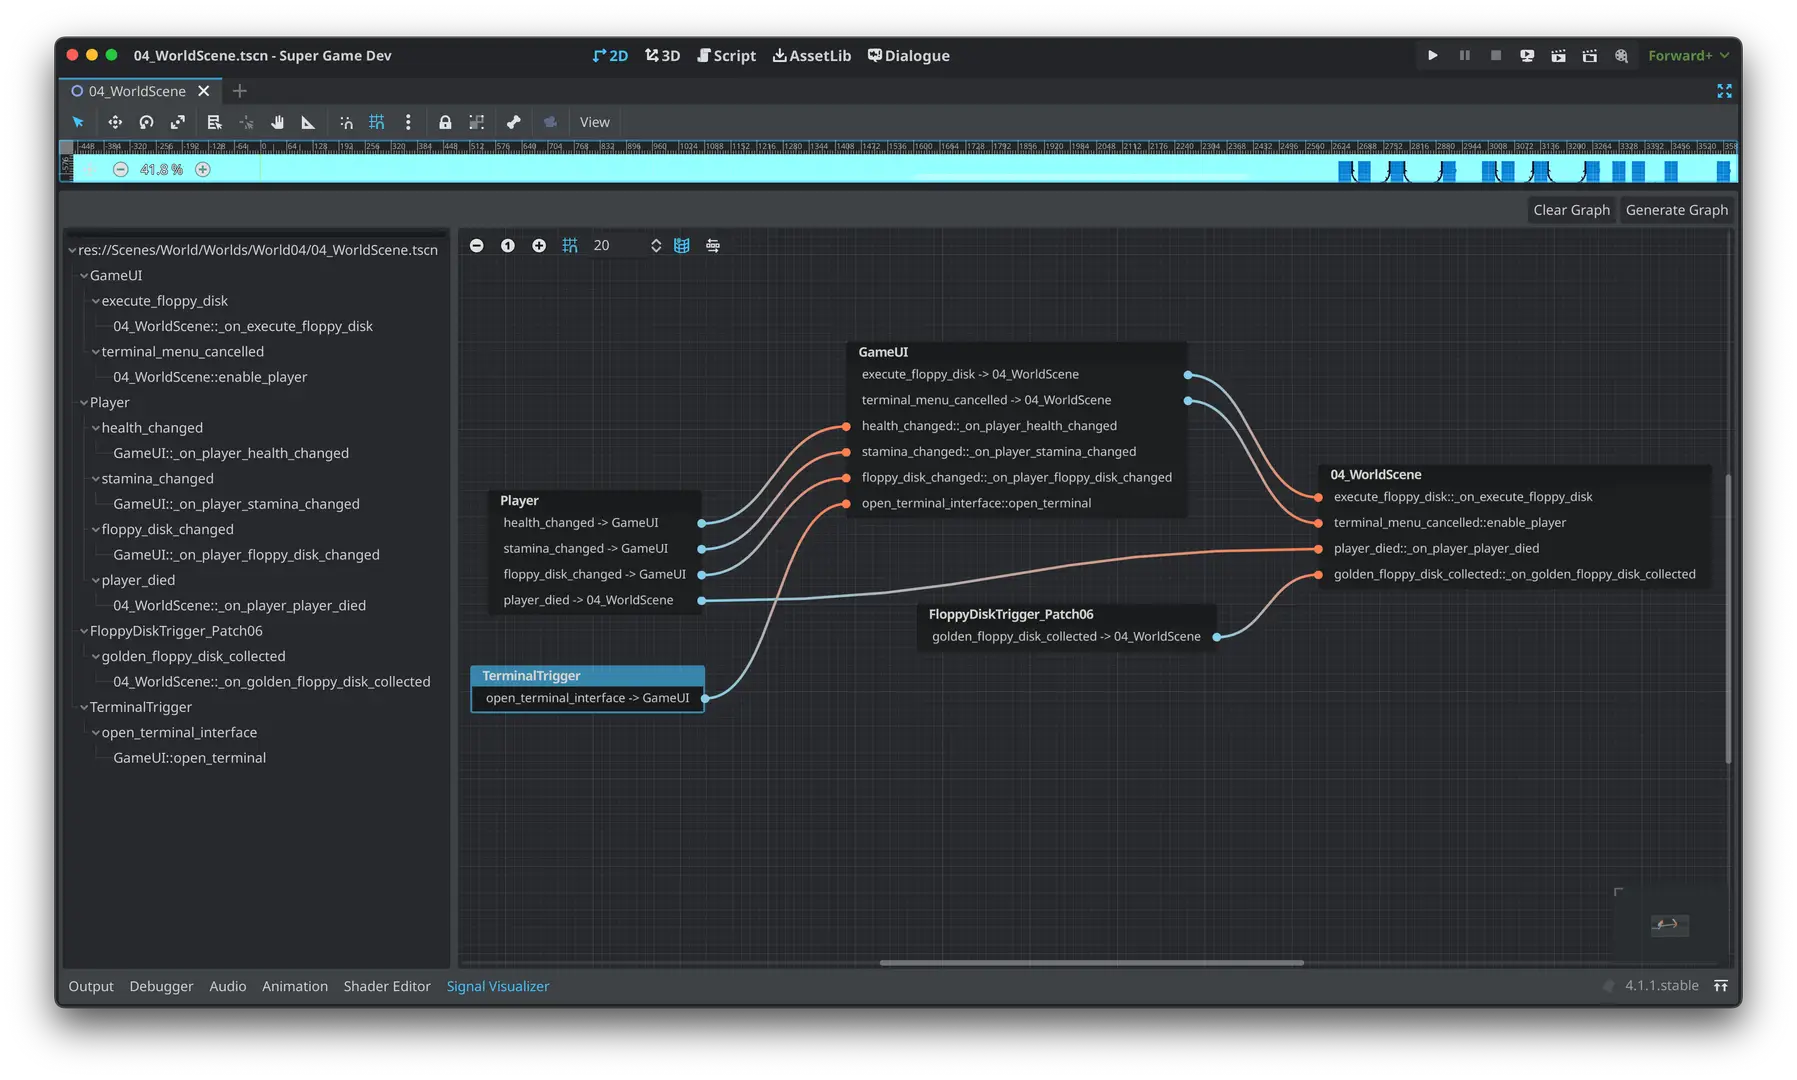
Signal Visualizer will create a signal graph by mapping the signals in the current scene in the Godot editor. The bottom dock uses the built-in GraphEdit and Tree nodes to display the signal graph. Only signals with the flag of CONNECT_PERSIST will be displayed in the signal graph. In addition, all nodes that begin with @ in the name will be ignored.
- With your scene open in the editor, open the bottom dock.
- In Signal Visualizer's top toolbar, click "Generate Graph"

Format
In the signal graph and tree, the format is as follows:
Outgoing Signal
Signal -> Connected Node

Incoming Signal
Signal::Callable Method

The SignalVisuzlizer plugin comes with two tools to help with managing and debugging your scene's signals.
The first tool is the visualizer. This displays the current scene's signals and their connections in an easy to read graph and tree.
The second tool is the debugger. With a running scene, activate the debugger to automatically log all relevant signals to the custom Signal Debugger panel.
Reviews
Quick Information
SignalVisualizer
The SignalVisuzlizer plugin comes with two tools to help with managing and debugging your scene's signals.The first tool is the visualizer. This displays the current scene's signals and their connections in an easy to read graph and tree.The second tool is the debugger. With a running scene, activate the debugger to automatically log all relevant signals to the custom Signal Debugger panel.
Supported Engine Version
4.0
Version String
1.7.0
License Version
MIT
Support Level
community
Modified Date
1 year ago
Git URL
Issue URL